
Will CMP470’s commitment fee clear the battery queue if battery revenues fall as more batteries connect?
Evidence for Ofgem’s CMP470 impact assessment
What CMP470’s commitment fee would do depends on whether project owners believe battery revenues will fall as more batteries connect, and when they find out whether revenues do fall. Both affect whether the commitment fee would switch on at all, how much of the battery queue it would clear, how much sooner projects would leave, and what it would cost those that connect. We compare three cases:
- No fall. Every project owner makes their decisions assuming revenues will stay at today’s level, and they turn out to be right. This is the case in our published analysis, Will CMP470’s commitment fee clear the battery queue?1
- Fall expected from today. Every project owner makes their decisions from today assuming revenues will fall as more batteries connect, and they turn out to be right. This is the extreme where every project owner acts on the fall today, before revenues have started to fall.
- Fall uncertain until the build decision. Every project owner makes their decisions thinking a fall in revenues is as likely as not, and finds out at their build decision that revenues do fall. This is the extreme where no one knows for sure until they have to decide whether to build.
The evidence we sent Ofgem for its CMP470 impact assessment
Brief, 6 pages, PDF · 10 November 2026
In all three cases, project owners face the same other uncertainties: how late their connection will come, what the connection works will cost, any further delay, the market outlook and the market’s strength (both separate from any fall in revenues as more batteries connect), the Capacity Market price and whether they win a Capacity Market agreement. We also model whether Ofgem approves the commitment fee, but the results here take it as approved. The futures are drawn the same way in all three cases: each of the 54 project types that make up the 78.6 GW of batteries in the Gate 2 queue is valued across the same 8,000 futures (432,000 combinations of project type and future). So the only differences between the three cases are whether revenues fall as more batteries connect and what owners know about it.
Results from the QueueQuant stochastic optimisation engine
In cases 2 and 3, the revenue feedback is modelled inside the engine: revenues depend on how many projects connect, and how many projects connect depends on revenues, so the runs solve for both at once (Annex 1).
How much of the queue leaves
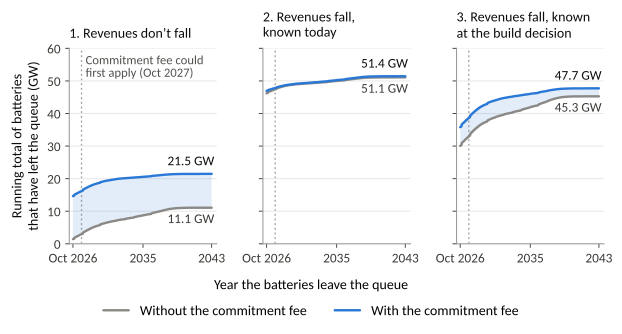
When revenues fall as more batteries connect, the commitment fee adds far less: at most 2.5 GW, against 10.4 GW when revenues don’t fall. That is partly because the revenue fall itself pushes out almost all the projects that leave, and partly because each project that leaves lifts revenues for the ones that stay, so some that were close to leaving stay after all. In Figure 1, the shaded area between the two lines shows how much more capacity has left the queue by each date because of the commitment fee. When owners know about the fall today, the lines almost overlap, because most of those that will leave go at once anyway. When they only find out at their build decision, many hold on, so the commitment fee still gets 5.7 GW more out at once. “At once” means at the owners’ first decision, which the runs date to the end of October 2026. In reality, owners would act over the following months, and many would wait for Ofgem’s decision on CMP470; when revenues don’t fall (case 1), modelling Ofgem’s decision as uncertain, so that owners can wait for it, changes how much the commitment fee clears only a little: 9.5 GW rather than 10.4 GW.1
Would the commitment fee switch on?
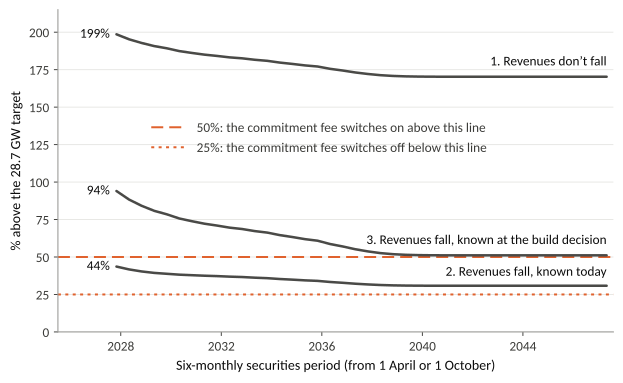
When owners know about the revenue fall today, the commitment fee would not switch on at all: in October 2027, when it could first apply, the queue is 44% above the 28.7 GW target, below the 50% that would switch it on.2 That is because most of the projects that will leave go at once, a year before the commitment fee could apply. In Figure 2, the commitment fee would switch on when a line is above the dashed 50% line, and would then stay on until the queue fell below the dotted 25% line.3 When owners only find out at their build decision, many hold on, so the queue is still 94% above the target in October 2027 and the commitment fee would switch on. As when revenues don’t fall, the commitment fee would then stay on to the end of the runs in 2047, because even with it in place the queue never falls below 25%. Built batteries still count, so the queue falls only as projects leave, and almost none leave after 2040. In reality, NESO would assess the queue in May or November, about five months before each period starts,2 rather than at the start as the runs do, but that does not change the conclusions: in May 2027 the queue would be 45% above the target in case 2 and 98% in case 3. Any new projects joining the queue would keep the commitment fee on longer, and projects leaving for reasons the runs leave out, such as refused planning consent, would bring the queue down sooner. In case 3, it wouldn’t take much: by the end of the runs, another 5.0 GW leaving would switch the commitment fee off, against 31.3 GW when revenues don’t fall.
How much sooner do projects that leave anyway go?
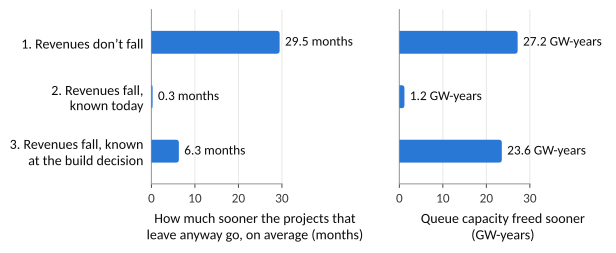
As Figure 3 shows, when revenues fall as more batteries connect, the commitment fee gets the projects that would leave anyway out only months sooner, not years: 6.3 months at most, against 29.5 months when revenues don’t fall. That is because the fall itself makes them leave early: without the commitment fee, they would leave on average in March 2027 in case 2 and April 2028 in case 3, against the end of 2030 when revenues don’t fall, so the commitment fee has less time to save. The figure’s left panel shows how many months sooner these projects leave, on average, and the right panel multiplies that by how much capacity they hold. When owners know about the fall today, the commitment fee gets them out only 0.3 months sooner, because most of them go at once anyway. When owners only find out at their build decision, the projects leave 6.3 months sooner with the commitment fee, but far more capacity is leaving anyway: 44.8 GW, against 11.1 GW when revenues don’t fall. So the queue capacity the commitment fee frees sooner, 44.8 GW for 6.3 months or 23.6 GW-years, is close to the 27.2 GW-years when revenues don’t fall (11.1 GW for 29.5 months). In reality, many owners would wait for Ofgem’s decision on CMP470 before acting, which could reduce how much sooner they leave; Annex 2 includes running case 3 that way.
What would it cost the projects that connect?
When revenues fall as more batteries connect, the commitment fee would cost the projects that connect less than half as much: £1,937 per MW in case 3, against £4,479 when revenues don’t fall. For these projects the commitment fee is not a payment: it sets a minimum on the security they put up until they connect,3 so its cost is the money tied up in any extra security and the bank’s charge on it.1 Even for the same projects, the fall roughly halves the cost: for those that connect in case 3, it would be £3,977 per MW if revenues didn’t fall. The commitment fee’s own cost to them falls only a little, to £3,445 per MW. Most of the drop is because the projects the commitment fee pushes out lift revenues for those that stay, which gives back £1,508 per MW. In case 2, if the commitment fee switched on, it would cost the projects that connect £2,786 per MW, against £4,626 for the same projects if revenues didn’t fall. These are averages: projects due to connect furthest off bear several times the cost of those due soonest, because they hold the extra security for longer. The runs keep the commitment fee on until every project has connected, so in reality any earlier switch-off would cut the cost further.
Conclusions
When revenues fall as more batteries connect, the fall itself pushes out most of the projects that leave, so the commitment fee would clear far less of the battery queue: at most 2.5 GW, against 10.4 GW when revenues don’t fall.
| 1. Revenues don’t fall | 2. Revenues fall, known today | 3. Revenues fall, known at the build decision | |
|---|---|---|---|
| Would the commitment fee switch on? | Yes | No (numbers below show what would happen if it did) | Yes |
| How much more of the queue would it clear? | 10.4 GW | 0.3 GW | 2.5 GW |
| How much sooner would projects that leave anyway go? | 29.5 months | 0.3 months | 6.3 months |
| How much queue capacity would that free sooner? | 27.2 GW-years | 1.2 GW-years | 23.6 GW-years |
| What would it cost the projects that connect? | £4,479 per MW | £2,786 per MW | £1,937 per MW |
Cases 2 and 3 use NESO’s forecast of the capacity of all batteries operating in Great Britain in October 2026 (12.5 GW).4 Whether the commitment fee would switch on in case 2 is sensitive to this figure, as the queue would then be 44% above the target, close to the 50% that would switch it on. If Ofgem can obtain NESO’s actual figure for October 2026, we will rerun cases 2 and 3 with it (Annex 2).
Annex 1. Method and assumptions
The engine. QueueQuant’s engine is a multi-stage stochastic optimisation with recourse. For each project, it finds the decisions that make the project worth most to its owner, who has to decide before knowing how its connection, the battery market and the other uncertainties will turn out, and can change course as they learn more. Each decision uses only what the owner would know at that point: what has happened so far, and the chances of what could happen next. The uncertainties are drawn as 8,000 futures, 200 ways a connection could turn out, each with 40 paths for the battery market, and every run uses the same 8,000. A project’s value allows for risk, with a quarter of it set by its worst 1 in 20 outcomes, and is discounted at a WACC of 10%.
The projects. QueueQuant’s engine values 54 project types, which differ in when they are due to connect, how much they earn, how far their consents have got and whether they have accepted their Gate 2 offer. Their shares follow how NESO’s TEC and Embedded registers spread the queue across connection dates (half with the offer in hand and half accepted, as the registers don’t show which),5,6 and together they make up the 78.6 GW of batteries still to connect: NESO’s 88.6 GW of batteries operating or with a Gate 2 offer,2 less the 10.1 GW that NESO’s TEC register and the DNOs’ registers show operating.5,7 Each type is valued across the same 8,000 futures. Owners decide at the end of October 2026 whether to keep their project, cut it back or leave the queue. They decide again at their build decision, 18 months before connection, whether to build or leave.
How revenues fall. Trading revenue per MW in year t is
where R0 is today’s level, Ct the battery capacity operating (10.1 GW today plus what connects from the queue), Kt NESO’s Ten Year Outlook path for GB battery capacity, and the subscript 0 marks October 2026, when K0 is NESO’s forecast of 12.5 GW.4 So revenues stay at today’s level while the batteries operating keep pace with NESO’s path, fall when there are more than that, and rise when there are fewer. We take e = ln(1/0.83)/ln 1.5 = 0.46 from Modo Energy’s outlook for German batteries, in which a 50% larger buildout cuts 2030 day-ahead revenues by 17%.8 It is the only public estimate we found that isolates battery capacity, and most other public evidence points to a steeper fall,9 which would leave the commitment fee even less to do; we can run a steeper fall for Ofgem (Annex 2). Capacity Market payments do not fall.
The revenue feedback. How many projects connect sets revenues, and revenues set how many projects connect, so the runs solve for both at once. This matters for the commitment fee: each project it pushes out lifts revenues for those that stay, so some that were close to leaving stay after all. Before this feedback, the commitment fee would push out 1.7 GW more in case 2 and 4.9 GW more in case 3; after it, 0.3 GW and 2.5 GW more, the results in the main text. In case 1 revenues stay at today’s level, so there is no feedback and the commitment fee pushes out 10.4 GW either way.
What owners know. In case 1, owners expect revenues to stay at today’s level, as in our published analysis.1 In case 2, they know from the start exactly how revenues will fall as more batteries connect. In case 3, they think a revenue fall is as likely as not and find out at their build decision whether it happens. The 200 ways a connection could turn out are split evenly between a revenue fall and no revenue fall, in matched pairs, so both halves have the same market paths and almost the same works costs and connection delays. The case 3 results we report are from the half where revenues do fall, as they do in case 2, except the commitment fee’s cost, which is valued at the owners’ first decision, before they know whether revenues will fall. How much the commitment fee does in case 3 depends on the chance owners give a revenue fall: holding revenues as they are in case 3, the projects the commitment fee pushes out at once respond to it only when owners put that chance between about 0.40 and 0.57. Below that range, these projects hold on with or without the commitment fee; above that range, they leave at once either way.
CMP470. The commitment fee follows the proposed ladder, rising from £3,000 per MW in October 2027 to £25,000 per MW by April 2030.2,3 It sets a minimum on the security a project puts up until the battery connects; the security is returned when the battery connects and lost if the project leaves.3 The runs take Ofgem’s approval as given and keep the commitment fee on until each project connects. They also count the queue as CMP470 would, to see whether its rule would switch the commitment fee on (more than 50% above the target) or off (less than 25% above).2,3 The count is the batteries operating or with a Gate 2 offer, against the 28.7 GW target for 2035;2 built batteries stay in it, and no new projects join the queue. The runs assess it at the start of each six-monthly securities period; NESO would assess it about five months earlier,2 but that does not change the conclusions.
A technical note setting out every assumption, its spread across the futures and its source is available on request.
Annex 2. Further runs we can do for Ofgem
Use NESO’s actual battery capacity for October 2026. Our results for cases 2 and 3 use NESO’s forecast of the capacity of all batteries operating in Great Britain in October 2026 (12.5 GW),4 because we have no actual NESO figure for that month. How far revenues fall depends on the batteries operating compared with this figure. Whether the commitment fee would switch on in case 2 is sensitive to it: the queue would be 44% above the target in October 2027, close to the 50% that would switch it on, and a lower actual figure would mean higher revenues and fewer projects leaving. If Ofgem can obtain NESO’s actual figure for October 2026, we will rerun cases 2 and 3 with it.
Let owners learn about the revenue fall review by review. Cases 2 and 3 are the two extremes: owners know about the revenue fall from the start, or find out only at their build decision. In reality they would learn as revenues move, at each six-monthly review. We can model that, calibrated to how projects have actually left NESO’s TEC register in its monthly editions since January 2021.5
Run a steeper revenue fall. How strongly revenues fall as more batteries connect is set by e = 0.46 (Annex 1), taken from the only public estimate we found that isolates battery capacity;8 most other public evidence points to a steeper revenue fall.9 We can rerun cases 2 and 3 with a steeper one, such as e doubled to 0.92, which would push out more projects without the commitment fee and leave it less to do.
Add new applications to the queue. The runs add no new projects to the queue. New Gate 2 offers would raise the count CMP470 uses and keep the commitment fee on longer. If NESO can share its expected battery applications by year, we can add them.
Let buyers with a lower WACC buy projects. In the runs, owners either keep their projects or leave the queue. In our published analysis, where revenues don’t fall (case 1), letting buyers with an 8% WACC buy projects cut what the commitment fee clears from 10.4 GW to 0.1 GW, because owners sell rather than leave.1 We can run this with the revenue fall.
Model Ofgem’s decision as uncertain in case 3. The results take Ofgem’s approval of CMP470 as given. In reality many owners would wait for Ofgem’s decision before acting, which could reduce how much sooner the commitment fee gets projects out. When revenues don’t fall (case 1), modelling the decision as uncertain changes how much the commitment fee clears only a little: 9.5 GW rather than 10.4 GW.1 We can run case 3 the same way; case 2 does not need it, because there the commitment fee would not switch on whatever Ofgem decides.
References
- QueueQuant (2026). Will CMP470’s commitment fee clear the battery queue? https://queuequant.com/use-cases/commitment-fee-battery-queue/
- NESO (2026). Final Modification Report CMP470: Introducing an Oversubscribed Technologies Commitment Fee. 14 July 2026. https://www.neso.energy/document/384486/download
- Ofgem (2026). Minded-to Consultation: Connection and Use of System Code (CUSC) CMP470: Introducing an Oversubscribed Technologies Commitment Fee. 17 September 2026. https://www.ofgem.gov.uk/sites/default/files/2026-09/CMP470-Minded-to-Consultation.pdf
- NESO (2026). Ten Year Outlook 2026 Data Workbook, version 1. 9 September 2026. https://www.neso.energy/document/386516/download. The October 2026 figure, 12.5 GW, is interpolated between its 1 January 2026 (10.0 GW) and 1 January 2027 (13.1 GW) figures.
- NESO. Transmission Entry Capacity (TEC) Register, edition of 22 October 2026. https://www.neso.energy/data-portal/transmission-entry-capacity-tec-register
- NESO. Embedded Register, edition of 22 October 2026. https://www.neso.energy/data-portal/embedded-register
- UK Power Networks, National Grid Electricity Distribution, SSEN, SP Energy Networks, Northern Powergrid and Electricity North West. Embedded Capacity Registers, editions of August to October 2026.
- Modo Energy (2026). German BESS investment outlook: Executive summary. 16 March 2026. https://modoenergy.com/research/en/germany-battery-investment-outlook-q2-2026-executive-summary
- Timera Energy (2026). GB LDES adds pressure but 4hr BESS remains attractive. 19 October 2026. https://timera-energy.com/blog/gb-ldes-adds-pressure-but-4hr-bess-remains-attractive/
Supported by National Energy SO Open Data.
How to cite this page
You’re welcome to quote our results, charts and findings with this credit:
QueueQuant, “Will CMP470’s commitment fee clear the battery queue if battery revenues fall as more batteries connect?”, queuequant.com/use-cases/commitment-fee-falling-battery-revenues/ (November 2026).